[限免]比特币跌了30%,巨鲸却多拿了27万枚BTC:这一年,筹码到底发生了什么?
Published: 2026-08-26 12:57
Views: 3,303
![[限免]比特币跌了30%,巨鲸却多拿了27万枚BTC:这一年,筹码到底发生了什么?](/u/cms/www/editor/202608/cfa88df7ff0e4f3344919c462db37cf7.jpg)
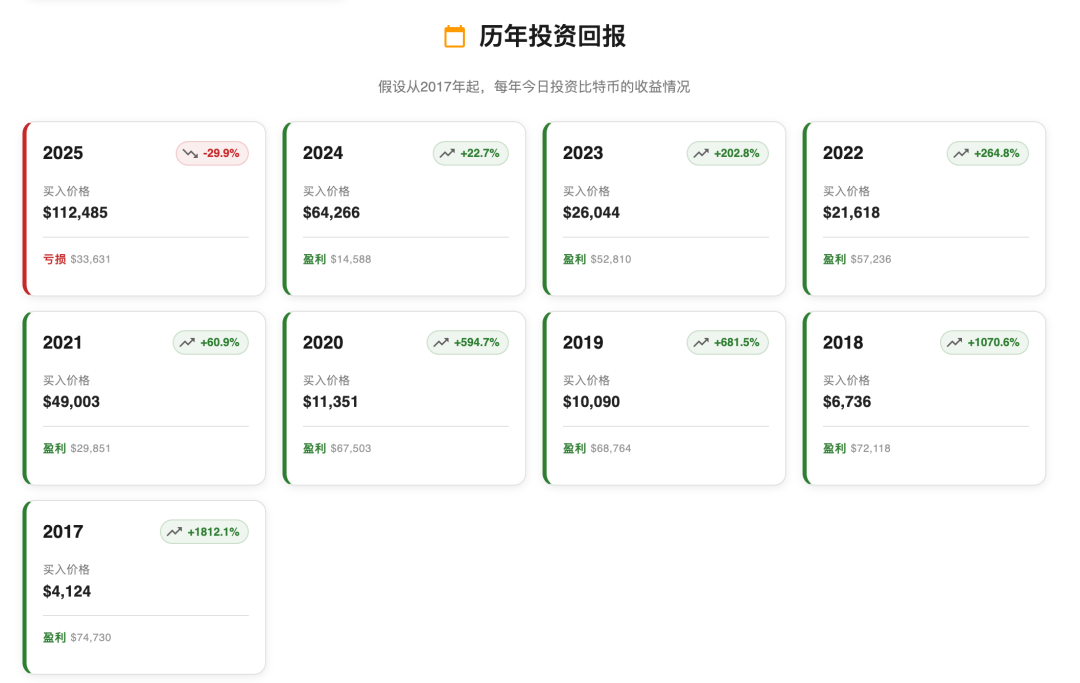
On August 26, 2025, Bitcoin was trading at $112K, compared to $64K in 2024 and $26K in 2023. Now, with the price at $78K, it seems to confirm a widely held belief in the crypto community.If you've held Bitcoin long enough, a four-year horizon has historically been highly likely to yield profits. Of course, I'd add that if you consistently dollar-cost average, losses become even less likely. (Personal opinion, not investment advice.)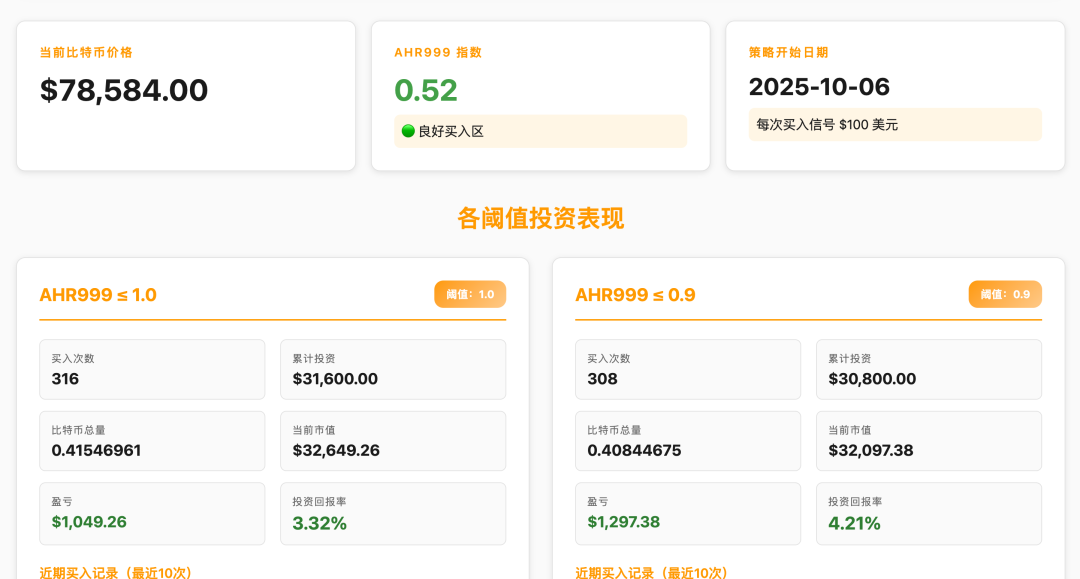
Reference: ahr-dca.btcha.comI often talk about Bitcoin's structural changes—whether you can feel them depends on your experience, especially if you've been through a full cycle. Today, with the help of AI, I want to analyze how Bitcoin's on-chain data has shifted over the past year.This article is normally exclusive to Coffee members, but it's free for 2 days before going back behind the paywall.Bitcoin dropped 30%, yet whales added 270,000 BTC:
What really happened to the supply this year?
As of August 26, 2026, Bitcoin has climbed back to around $80,000. On August 25, BTC briefly touched about $81,200 before pulling back, and it's currently trading near $79,000.According to Bitfinex data, BTC was around $78,800 on August 26, with a 24-hour high of $81,300.From a price perspective, it feels like we're back at a familiar level.Last year, Bitcoin rallied steadily, hitting an all-time high of about $126,000 in October 2025. Since then, the market has undergone a sustained correction, dipping as low as roughly $58,000.By June 2026, Bitcoin had fallen to around $59,000 before rebounding. If you only look at price, it's easy to dismiss this as a typical bear-market bounce.But when you combine that with these two fascinating data charts, the picture changes.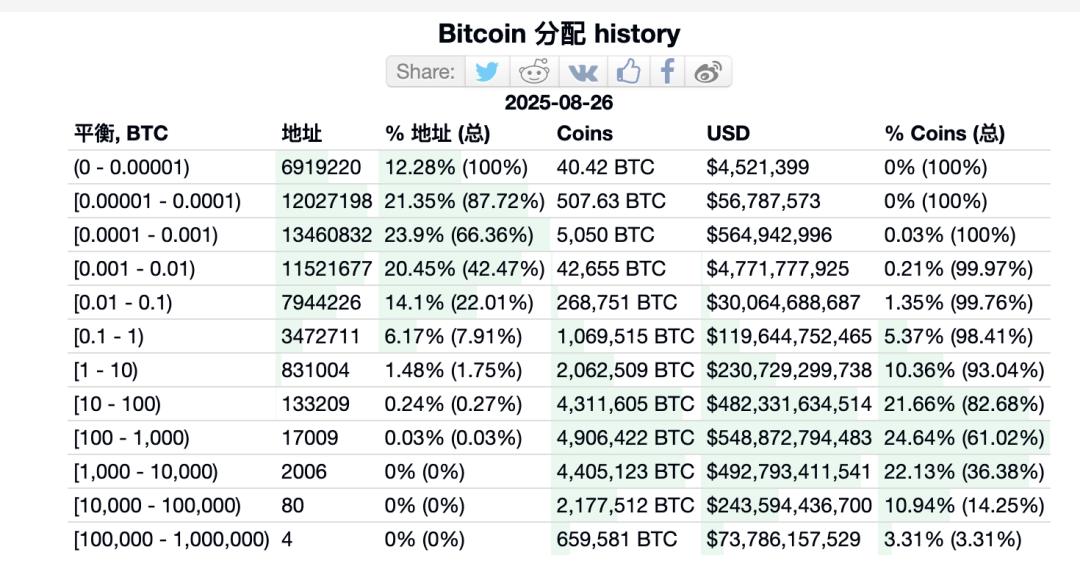
The first chart shows the distribution of Bitcoin-holding addresses on August 26, 2025.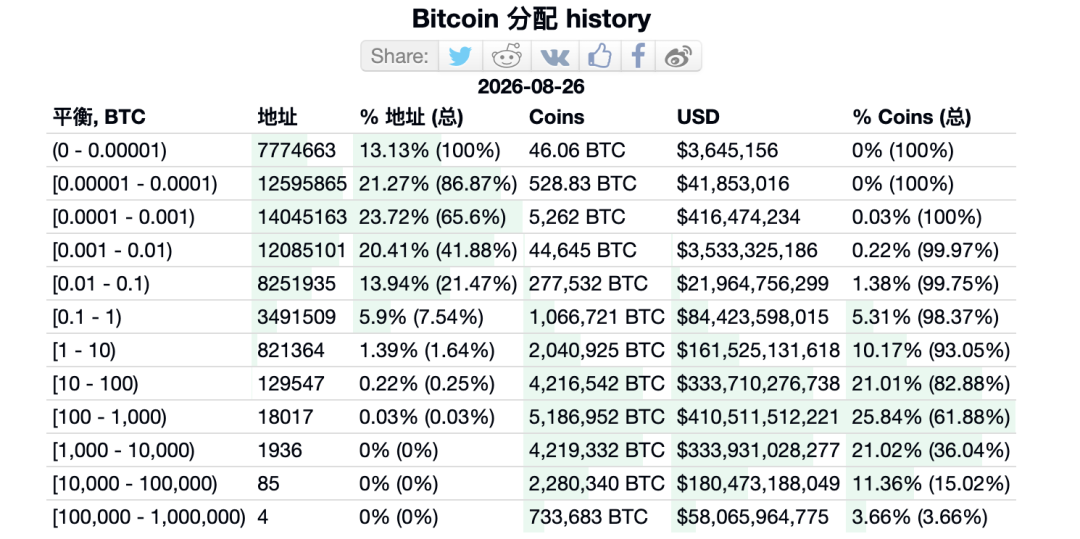
The second chart shows the same data exactly one year later, on August 26, 2026.Putting these two charts side by side, I think the most important question isn't whether Bitcoin can reach $100,000—it's what has actually happened to the supply distribution over the past year.1. The biggest change: Bitcoin fell, but addresses with 100+ BTC added 270,000 coins
On August 26, 2025, all tracked address ranges combined held approximately 19.9093 million BTC.By August 26, 2026, that number had risen to about 20.0725 million BTC.That's an increase of roughly 163,200 BTC over the year—almost exactly matching Bitcoin's new issuance during that period. What's truly worth examining is where those new coins ended up.In August 2025, addresses holding 100+ BTC collectively controlled about 12.1486 million BTC. A year later, that figure had grown to 12.4203 million—an increase of roughly 271,600 BTC, or about 2.24%.This reveals something quite interesting.Over the past year, Bitcoin's price fell from its all-time high and the market went through a sharp correction, yet the amount of BTC held by addresses with 100+ coinsactually increased.From a price standpoint, this year was clearly tough. But from a supply-distribution perspective, there's been no large-scale collapse.The coexistence of these two facts is itself worth deep study.2. Looking higher up, concentration becomes even more pronounced
Addresses holding 1,000+ BTC collectively held about 7.2422 million coins in August 2025. By August 2026, that number was roughly 7.2313 million.That's a decline of only about 10,900 BTC—a change of less than 0.2%.In other words,the 1,000+ BTC tier has remained essentially stable.The real changes are happening at even larger address sizes.Addresses with 10,000+ BTC saw their holdings rise from about 2.8371 million to 3.0137 million coins.That's an increase of 176,600 BTC, or about 6.23%.Addresses with 100,000+ BTC grew from about 659,600 to 733,700 coins.That's an increase of 74,100 BTC, or about 11.23%.Currently, there are only 4 addresses holding 100,000+ BTC, and together they control about 733,700 BTC—3.66% of the total supply tracked in this table.Let me add some context here:These 4 addresses are Binance's two cold wallets, Robinhood's cold wallet, and Bitfinex's cold wallet.
They're all exchange or custodian reserve pools, representing the assets of millions of users. The largest, 34xp4vRoCGJym3xR7yCVPFHoCNxv4Twseo, holds 248,598 BTC.
This address has been receiving Bitcoin continuously since October 2018, but its last outgoing transaction was in January 2023. In other words, Binance's largest cold wallet has been accumulating for over three years without sending a single coin out.
Think about it: when the largest holders keep accumulating without ever selling, the amount of Bitcoin actually available for trading keeps shrinking. Supply tightens, and demand recovery is just a matter of time.
There are also only 89 addresses holding 10,000+ BTC, yet they collectively control about 3.0137 million BTC—roughly 15.01% of the total.These numbers are striking: just 89 addresses control over 3 million BTC, and 4 mega-addresses control over 730,000 BTC.Of course, this absolutely shouldn't be interpreted as 89 individuals. The vast majority are exchange cold wallets, institutional custody addresses, ETF-related addresses, corporate wallets, and aggregated addresses from the same institution—all of which can produce massive balances.So, address count cannot be directly equated with the number of real investors.But the holding structure still has tremendous analytical value, because it tells us which balance ranges BTC is concentrating into.3. The really interesting part: mid-tier whales are diverging
If you add up everything above 100 BTC, holdings increased by about 271,600 coins over the past year. But this growth isn't happening uniformly across all large-address ranges.In 2025, the 100–1,000 BTC range held about 4.9064 million coins. By 2026, that range had grown to 5.1889 million.That's an increase of about 282,500 BTC, or 5.76%—a very clear uptick.But the 1,000–10,000 BTC range fell from 4.4051 million to 4.2176 million—a decline of about 187,500 coins.This creates a fascinating structural picture:100–1,000 BTC: +282,500 coins.1,000–10,000 BTC: −187,500 coins.10,000+ BTC: +176,600 coins.This shows that over the past year, Bitcoin supply hasn't simply moved in one direction.A more accurate interpretation is that some supply has been redistributed, while larger asset pools have continued to accumulate.The 10,000+ BTC range, in particular, shows very strong growth.So rather than summarizing this as "whales are frantically accumulating," I'd describe it this way:Over the past year, Bitcoin supply has shown a clear trend of further concentration into higher holding ranges.4. One detail that may matter even more than whale accumulation
Look at all addresses holding less than 1 BTC.In 2025, they collectively held about 1.3865 million BTC. In 2026, that's roughly 1.3948 million.That's an increase of only about 8,500 coins over the entire year.The market added roughly 163,200 BTC in a year, but sub-1 BTC addresses absorbed less than 10,000 of them. This means newly issued BTC is not being evenly distributed across all holding ranges.The far more significant changes are happening above 100 BTC.This is why I believe the current Bitcoin market increasingly needs to be understood through the lens of "supply structure."Price movements are just the surface. What truly determines price elasticity is how much BTC is willing to enter circulation.If, say, 10 million BTC remain dormant for long periods, then the price is really determined by the much smaller pool of BTC that's actually available for trading.If that liquidity continues to shrink, even without dramatic growth in new capital inflows, we could see significant price swings.5. This brings us back to the "four-year cycle" we've discussed
Bitcoin's classic pattern has been: rally after the halving, then euphoria, a price peak, a massive sell-off, followed by two to three years of consolidation before the next cycle begins.Coffee members, please refer to my two previous articles.[Free] 2017, 2021, 2025: Is this cycle still "repeating"?In 2017 and 2021, people had grown accustomed to this rhythm.But the current situation is different. After peaking at around $126,000 in 2025, the market has spent nearly a year pulling back—at one point dropping more than half from the high—before recovering to around $80,000.Over the past year, Bitcoin has undergone a clear price correction, yet the address balance structure shows no broad contraction in large-holding ranges.Holdings in 100+ BTC addresses increased by about 271,600 coins, with their share rising from 61.02% to 61.88%.10,000+ BTC addresses added roughly 176,600 coins, with their share climbing from 14.25% to 15.01%.This means that, at least based on the final on-chain balance distribution, there has been no broad, large-scale shift of coins into small addresses—instead, supply has become even more concentrated in larger holding ranges.This is why I'm increasingly inclined to believe this cycle may be experiencing both a "temporal