
Many people who get involved with Bitcoin go through a phase after a while. At first, they know nothing, and when they see others saying it's going up, they think it will rise; when others say it's dropping, they start to worry. Gradually, they learn to read candlestick charts, studying support levels, resistance levels, moving averages, and trading volume. Later, they add MACD, RSI, Bollinger Bands, and the Fear and Greed Index to their watchlists. When they open their trading app, the screen is packed with lines. After staring at it for a while, the same question lingers: So, is Bitcoin going up or down? This is actually the most awkward stage for many after diving into technical analysis. They've learned a bunch of indicators, but the numbers in their account haven't increased accordingly. So today, I want to discuss a topic rarely covered in previous articles: Does technical analysis actually work in the Bitcoin market?
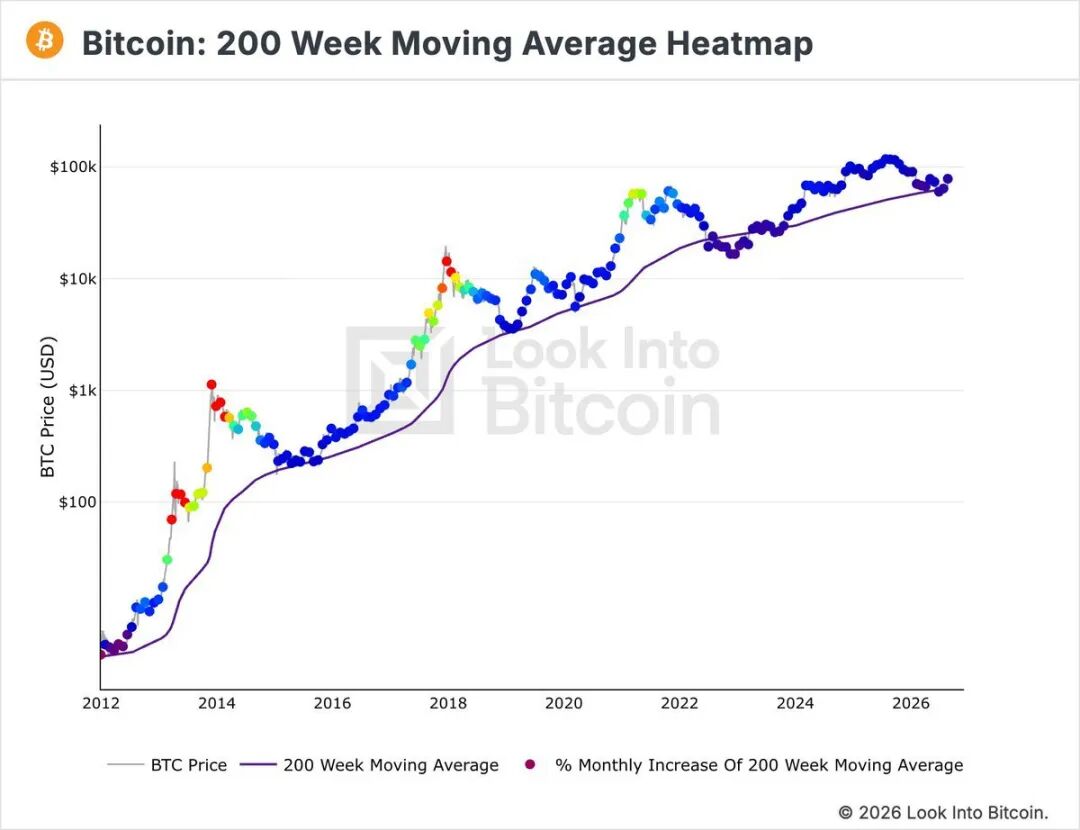
K-lines, moving averages, RSI, MACD, Bollinger Bands, the Fear and Greed Index—these things everyone talks about daily—are they actually helping us read the market, or just giving ourselves some psychological comfort? What exactly is a K-line? Let's start with the basics. A single K-line isn't that mysterious; it records four prices over a period: open, close, high, and low. For example, a daily K-line captures Bitcoin's price changes within one day. The solid body in the middle represents the range between the open and close, while the lines extending above and below are called wicks, corresponding to the highest and lowest prices that day. If the close is higher than the open, it's typically a bullish candle; if the close is lower, it's a bearish candle. Many people studying K-lines look at patterns like hammer heads, doji stars, engulfing patterns, morning stars, and so on. Do these have value? Yes, but don't treat them like lottery numbers. A doji star doesn't guarantee a drop the next day, and a hammer head doesn't mean prices will bounce immediately. K-lines themselves don't have predictive power; they record what just happened in the market. What's truly valuable is placing K-lines within the context of the market environment at that time. For instance, after Bitcoin has been falling continuously, a long lower wick appearing in a long-term support zone with increased volume, followed by a few candles slowly recovering, is completely different from a doji star appearing right after Bitcoin has surged 30%. The pattern might look the same, but the position differs, so the interpretation differs too. Why do so many people watch support and resistance levels? Support can be simply understood as an area where buying pressure tends to emerge when prices drop to that level. Resistance is the opposite—when prices rise to that point, selling pressure often increases. For example, if Bitcoin has repeatedly stopped falling around $65,000, the market naturally remembers that price. The next time BTC falls back near $65,000, those who missed buying earlier might consider entering, and those who bought there before might think "this level has support." So buying pressure could reappear. The same goes for resistance. So support and resistance aren't lines etched into the ground; they're more like a collective memory among traders. Where prices have passed, they leave behind positions and emotions. That's also why certain round numbers attract attention. 60k, 70k, 80k, 100k—these numbers have no magic in themselves, but people like round numbers, so the market gradually gives these prices meaning. Do moving averages actually work? Next up is the moving average, very common in technical analysis. MA, or moving average. People use 5-day, 10-day, 20-day, 60-day, 120-day, 200-day, and various other periods. The principle is simple: it averages prices over a past period and moves forward with time. The main role of moving averages isn't to tell you "whether it will rise or fall tomorrow," but to help you observe trends. For example, if Bitcoin stays above the 200-day moving average for a long time, many interpret that as a strong long-term trend; if prices stay below the 200-day MA, the market environment naturally weakens. Shorter-term MAs are more sensitive—the 5-day and 10-day lines track short-term rhythm, while the 20-day line is often used for medium-term trends. Another common term is the golden cross and death cross. When a short-term MA crosses above a long-term MA, it's called a golden cross; when it crosses below, it's a death cross.
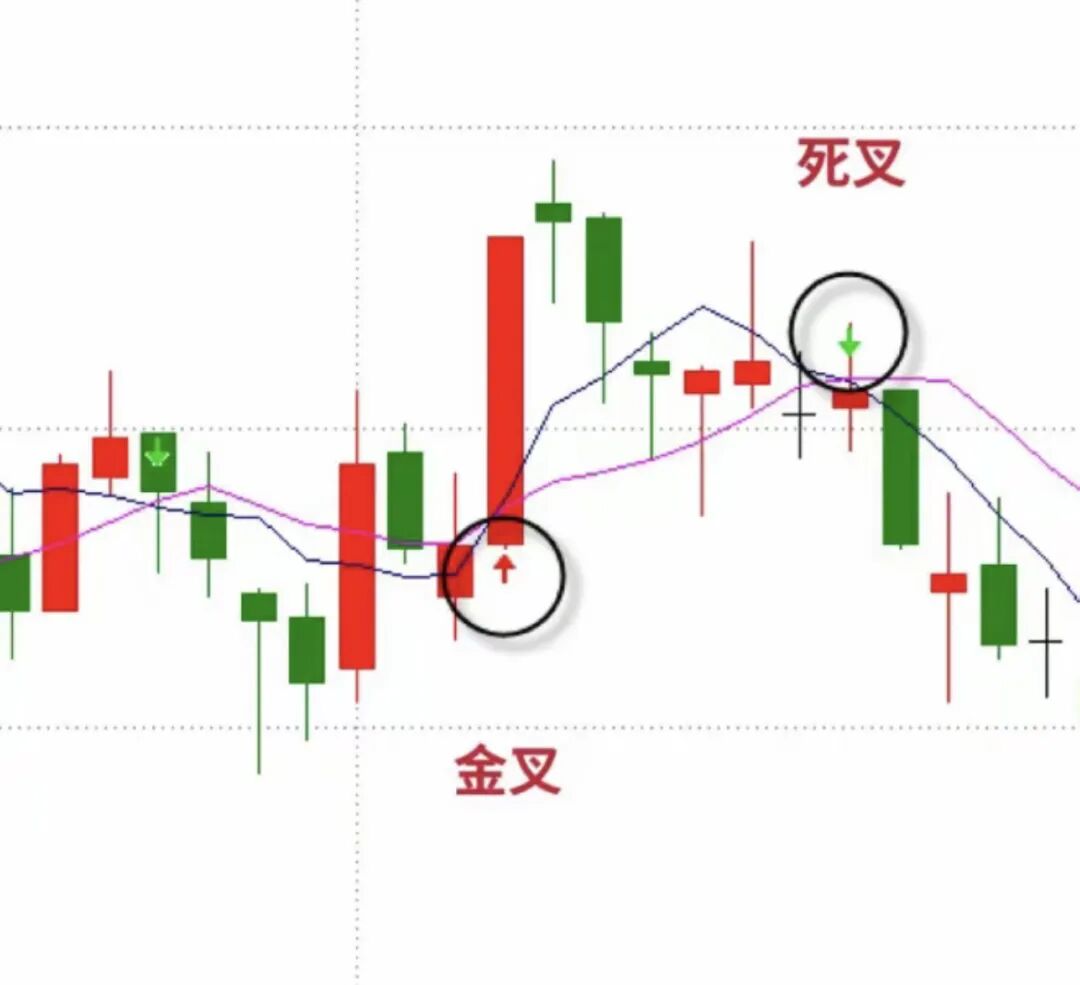
That sounds impressive, but when you actually backtest it against historical price data, you'll run into an awkward problem: in many cases, by the time the golden cross appears, Bitcoin has already risen a chunk; and when the death cross shows up, the price may have already dropped a bit. So moving averages are better suited for confirming trends rather than predicting prices. Why do people talk about overbought and oversold with RSI all the time? RSI, or the Relative Strength Index, is a very common technical indicator in the crypto space. Most people are familiar with two key numbers: 70 and 30. When RSI is above 70, it's generally considered to be in the overbought zone; below 30, it's seen as oversold. So many people start thinking about selling when RSI exceeds 70, and begin preparing to buy the dip when it falls below 30. That's where the problem lies. Being overbought doesn't mean an immediate drop, and being oversold doesn't guarantee an immediate rise. In a strong trend, RSI can stay above 70 for a long time. If you sold every time RSI went above 70 during Bitcoin's steady climb, you might have exited way too early. The same goes for bear markets. When RSI drops below 30, it only indicates that the market has fallen sharply in the short term, but it doesn't ensure a rebound the next day. So RSI is more useful for gauging whether the market is moving too fast in the short term, rather than giving direct buy or sell signals. Why is MACD so popular? MACD is another indicator you can't avoid in technical analysis. The most common saying is that a golden cross signals bullish, and a death cross signals bearish. Beyond that, there's a term that gets a lot of attention: divergence. For example, if Bitcoin's price hits a new high but MACD doesn't follow suit with a new high, that's often called bearish divergence. Conversely, if the price makes a new low but MACD doesn't continue to make a new low, it can be understood as bullish divergence. Why does divergence get so much attention? Because it reflects a state where price and momentum aren't fully in sync. But there's a catch here too. Divergence can persist for a long time. In a strong trend, Bitcoin can easily keep rising while showing divergence, and then the price continues to hit new highs. So selling immediately on bearish divergence or buying the dip right on bullish divergence tends to oversimplify things. You need to consider position, trend, volume, and the overall market environment together. What's the use of Bollinger Bands? Bollinger Bands are also a favorite among technical traders. They typically consist of a middle band, an upper band, and a lower band, helping to observe price fluctuations and market volatility. When the market stays calm for a long time and volatility decreases, the Bollinger Bands may gradually narrow, which is often referred to as a "squeeze." In such cases, the market often tends to make a significant directional move afterward. But the issue remains the same. A Bollinger Band squeeze only tells you that the market is likely to move, not which direction it will go. It could break upward or downward. So seeing a squeeze and shouting "it's about to surge" is similar to seeing dark clouds and immediately concluding it will rain heavily tonight. You know the weather might change, but you don't know when the rain will come or if it will even happen. What exactly is the Fear and Greed Index? This indicator is particularly interesting in the crypto market because it doesn't just look at candlestick charts; it tries to turn market sentiment into a number. It typically combines factors like price momentum, market volatility, trading volume, social media sentiment, and Bitcoin's market dominance to measure the current level of fear and greed in the market.
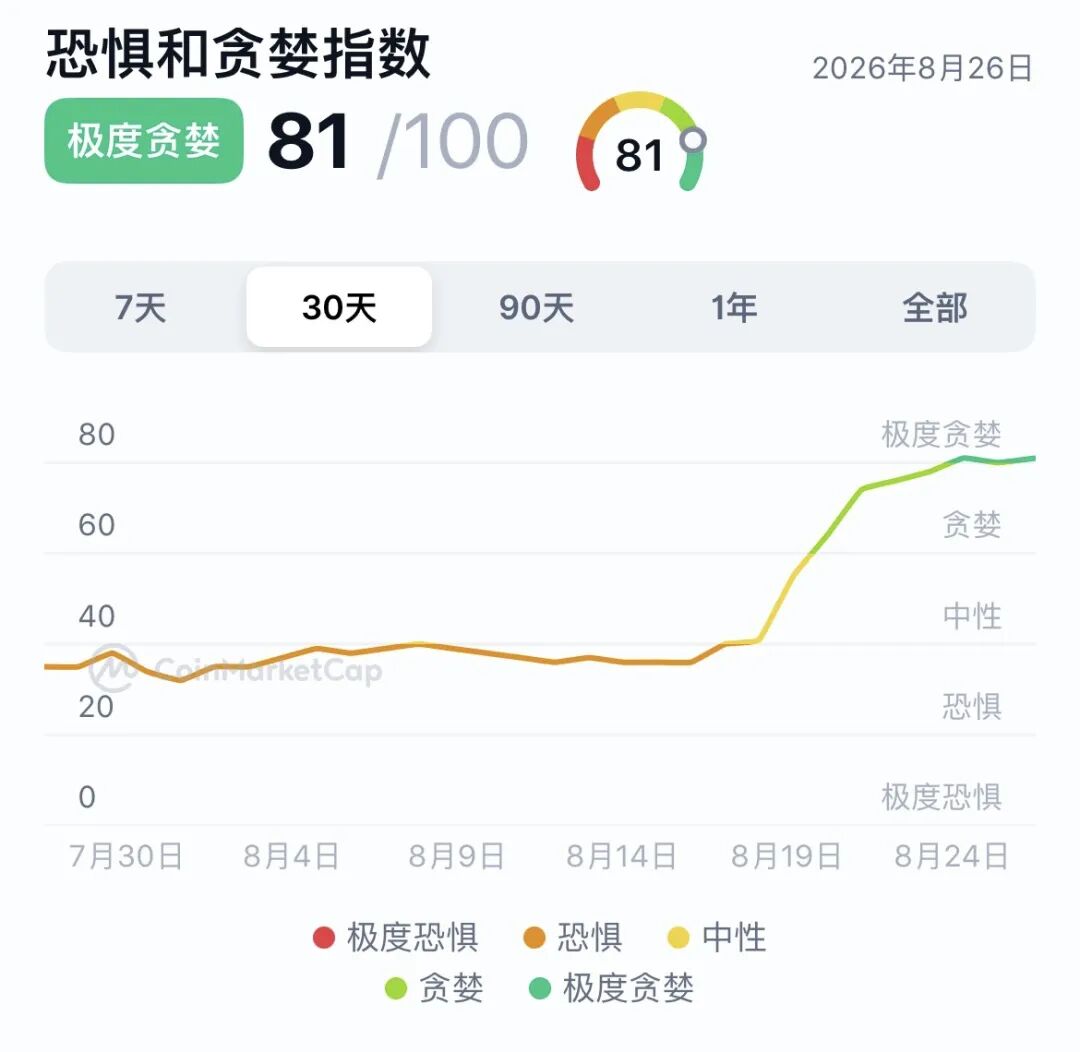
Simply put: the lower the index, the more fearful the market; the higher the index, the more excited the market. Many people like to treat it as a magic tool for bottom-fishing. When they see extreme fear, they say "time to buy," and when they see extreme greed, they say "time to sell." If things were really that simple, I guess none of us would need to work. The greatest value of the Fear and Greed Index, in my view, is helping us observe market sentiment, not directly deciding when to buy or sell. When the market is in extreme fear, it can remind you to check whether everyone is just overreacting to emotions; when the market is in extreme greed, it can also remind you not to lose your judgment just because prices are rising. It's more like a mirror, reflecting how scared or excited the market is right now. So, do these technical indicators actually work? The answer is: yes, they work, but not as magically as many people imagine. RSI, MACD, moving averages, Bollinger Bands, and candlestick patterns are all essentially derived from historical price and trading volume data. They don't contain future data. So technical analysis isn't about predicting the future; it's more about helping you build a relatively consistent set of judgment standards amid a pile of uncertainties. This point is actually crucial. Without any technical framework, a person might buy BTC just because a friend said "it's going up." If it rises 5%, they feel talented; if it drops 5%, they start doubting themselves; if it drops 10%, they run to ask group members what to do; and when it recovers, they can't bear to sell. The whole process is completely driven by emotions. With your own analytical method, at least you know why you're watching a certain level, under what conditions you admit you're wrong, and how much position you should control. The greatest value of technical analysis might not be getting it right every time, but losing a bit less when you're wrong. That statement is probably more reliable than "some indicator has a 90% win rate." Can technical traders actually make money with these tools? Of course, some can. But there's a practical issue here: people who can do technical analysis well over the long term often aren't those who memorize more indicators. Some people open a chart and pile on the 5-day, 10-day, 20-day, and 60-day moving averages, then turn on MACD, RSI, KDJ, and Bollinger Bands all at once, until the screen looks like a plate of spaghetti. Then when prices rise, they explain why these indicators look bullish; when prices fall, they explain why some indicator had already signaled a risk in advance. The biggest problem with this approach is that no matter how the market moves, you can always find an indicator to explain it to yourself. That's not a trading system; that's telling stories after the fact. Truly mature technical analysis might actually be very simple. What's the trend, where's the support, where's the resistance, is volume confirming, is the funding rate high, is open interest abnormal, what's the market sentiment level, and then manage your position size. Understanding 100 indicators isn't as good as truly mastering 5. The crypto market also has some data that traditional markets don't have as prominently, which is why I think technical analysis in crypto is quite interesting. Take the funding rate, for example. People trading perpetual contracts should be familiar with it. Longs and shorts make periodic payments through the funding rate. When a large amount of market capital is bullish, the funding rate can stay persistently high. If prices keep rising while the funding rate becomes more extreme and open interest rapidly increases, it suggests the market might be getting crowded. Everyone is on the same side. Once prices suddenly move in the opposite direction, it can trigger a cascade of liquidations. Another important metric is Open Interest, or OI for short. When prices rise and OI increases, it means new contract positions are entering; when prices rise but OI falls, it might be more about short covering driving the rally. Both scenarios might look like a green candle on the chart, but the underlying capital structure is completely different. Then there's liquidation data. When a large number of leveraged positions pile up in a certain price zone, once Bitcoin triggers a liquidation, it can lead to a chain of forced closures. So in the crypto space, you sometimes see these thrilling moves. You watch BTC suddenly surge and think some big positive news must have come out, but then you check the data and see that a large number of shorts were just liquidated. Prices keep rising, more shorts are forced to close, and the price gets pushed even higher. That's what people often call a "short squeeze." The same happens in downtrends. If long positions are too crowded, prices dip and trigger consecutive liquidations. So in the crypto market, looking at just the candlesticks sometimes isn't enough. Combining price, volume, OI, funding rates, and liquidation data lets you see much more. So, should you trust technicals or trust your gut? I think these two things don't actually conflict. When you first start looking at the market, feelings often outweigh technicals. You see BTC suddenly surge and think "it can go higher"; after a continuous decline, you feel "it's over." That feeling is essentially emotion. What technical analysis does is break down that vague feeling into pieces. If you think "it might drop," is it because the price hit a resistance level, or because volume is starting to decline, or because there's a MACD divergence? If you think "it might rise," is it a trend breakout, or just a large number of shorts being liquidated? When you can turn that feeling into a few verifiable conditions, your judgment gradually shifts from guessing to a systematic approach.

So if I really had to choose, I'd say: gut feeling is for spotting opportunities, technicals are for verifying them, and position sizing is for protecting your account. Miss any one of these, and you're asking for trouble. Finally, there's something even harder to master than indicators—you can study a pile of technical indicators and still fail, not necessarily because they're useless. Often, it's because you know what to do but don't follow through. You set a stop-loss, but when price hits it, you can't bear to leave; you plan to take profits at a certain level, but once it rises, you start dreaming of higher; you know leverage is risky, but when the market suddenly spikes, you can't resist cranking up your position. What do you do after losing money? Switch indicators. Research another set. Keep watching. Keep losing. In the end, when you stare at charts long enough, you realize technical indicators aren't the hardest part. The hardest part is controlling yourself. The market offers chances every day, but not every chance belongs to you. Sometimes you read the trend right but don't get a good entry price; sometimes you call the direction correctly but can't withstand the mid-way swings because your position is too big; and sometimes you're completely wrong, and the most important thing isn't proving you're right—it's admitting you're wrong quickly. So I increasingly feel that technical analysis isn't about turning yourself into a "prediction guru." It's more like a toolkit. Candlesticks show where price has been, moving averages help you see the trend, RSI gauges short-term strength, MACD tracks momentum, Bollinger Bands measure volatility, the Fear & Greed Index reflects market sentiment, and funding rates and OI let you see if the futures market is already overcrowded. Mastering all of these doesn't guarantee you'll do well in the market. But ignoring everything and just saying "I feel BTC will go up" easily turns investing into a coin flip. The lesson the market eventually teaches everyone is pretty much the same: technicals can help you see price, data can help you see the market, but whether you ultimately keep the money comes down to your own discipline.