

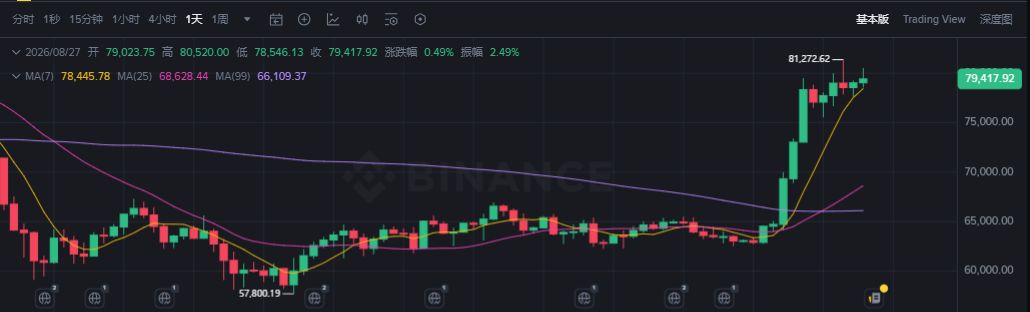
Bitcoin is currently trading near $79,400. After such a strong rally, the market is in dire need of a consolidation phase, so many may expect the price to pull back to the mid-to-low $70,000 range for a healthier correction.
From the bottom of this consolidation range to the local high, the price has dropped to the 0.618 Fibonacci level, bounced back after touching it, and two descending wedges have formed during the consolidation, both of which have broken upward.
Bitcoin has edged higher recently, up about 1.8% so far on Thursday. Once the price breaks above the previous high, the major resistance zone at $82,000 to $83,000 will be within reach.
If we compare the current setup with Bitcoin's 2023 bull market structure, the focus is on a weekly trend indicator that starts showing green dots as momentum strengthens.
A similar pattern could bring the weekly uptrend zone near $68,000 by October, which would be a significant drop from current levels, but the chart views this as a potential support retest rather than a confirmation of a bearish reversal.
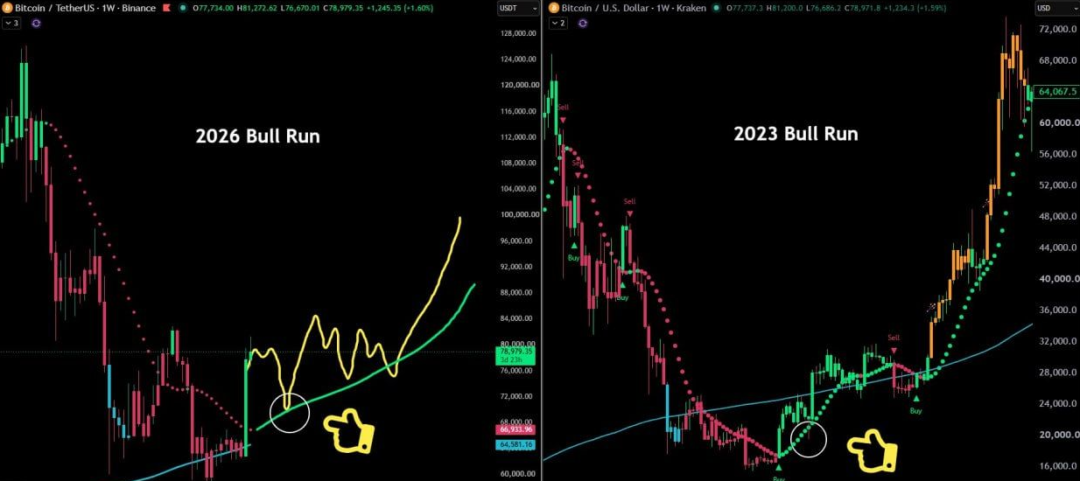
If Bitcoin pulls back to near the uptrend line, finds demand support, and forms a new higher low, the bullish thesis remains intact. A strong rebound in that zone could sustain the long-term structure to the upside and open the door for another push toward the $80,000 highs, or even the psychological $100,000 level shown in the chart projection.
If Bitcoin completely loses the weekly uptrend, the above projection would weaken. In that case, the historical comparison with 2023 becomes less reliable, and the market would need to establish new support levels.
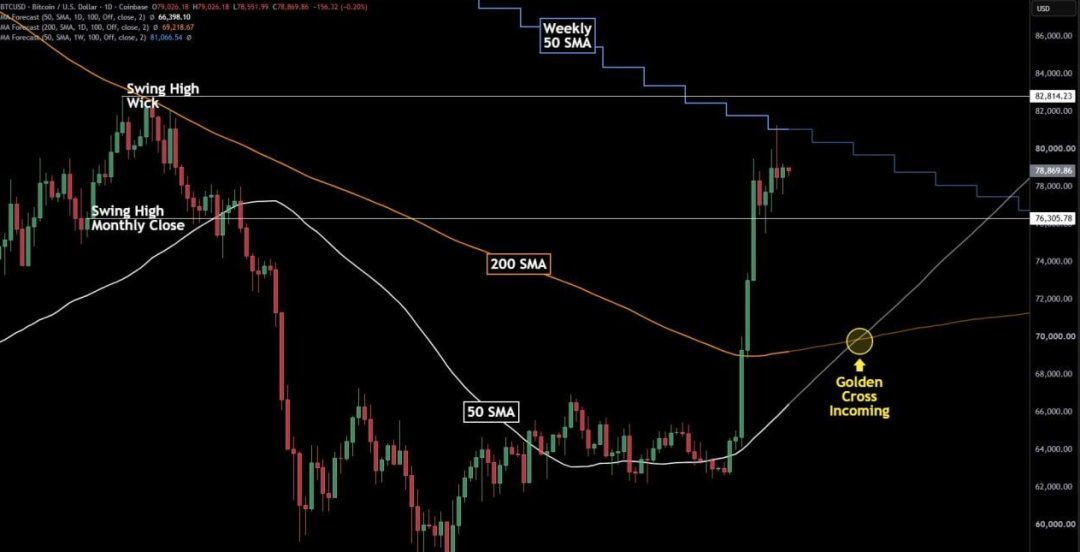
The next major resistance sits near $82,800. A decisive break above this level would form a higher high and reinforce the view that the rebound from the mid-$60,000 zone has evolved into a broader uptrend.
Bitcoin is also approaching the declining 50-period weekly moving average shown above. If the price can break above $82,800 and reclaim that average, it would more strongly confirm that buyers are overcoming the remaining overhead resistance.
For now, $76,300 is the first key downside support. Holding this level would maintain the current structure, while a break below it would increase the risk of a deeper correction. Combining both charts, Bitcoin may first challenge $82,800, but even if it subsequently drops to around $68,000, if that zone holds as support, it would present our next optimal entry opportunity.
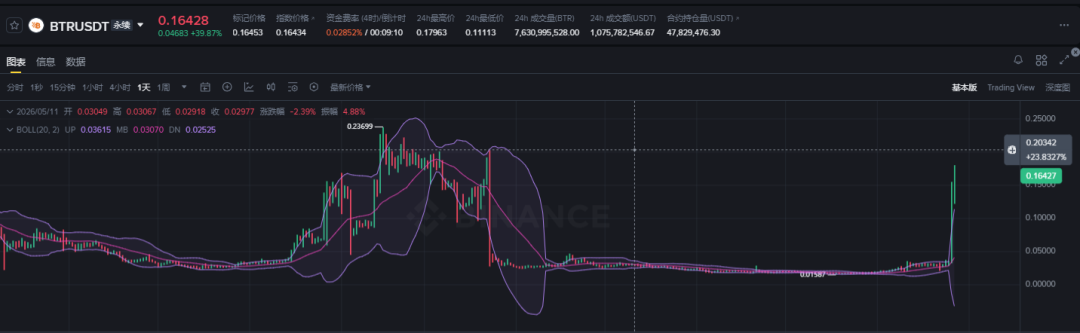
On the futures side:
BTR is worth watching closely. From the current perspective, it looks quite solid. On the K-line chart, after the March 23 waterfall decline, it has been in a bottom consolidation and accumulation phase for five months—a testament to the market maker's patience.
The rally began to build on the 11th of this month, and yesterday was particularly strong—shorts were mercilessly squeezed, while those riding the long trend reaped substantial gains.
Based on the accumulation timeline, it's highly likely that the majority of tokens are in the project team's hands. The purpose of the markup is obviously to distribute, which is the most transparent play in the market. As for when the dumping will begin, that's impossible to predict with precision.
We'll just have to take it one step at a time. Swing traders can choose to follow the trend, while those looking to short should wait—hold off until the price reaches around 0.2 and assess the specific price action before deciding whether to enter.