
Bitcoin Surges 26% in a Single Week, These Five Altcoins Soared Up to 100%
After nearly a year of dormancy, the crypto market suddenly experienced a fierce rebound last week.
Bitcoin climbed from around $62,800 at the start of the week, peaking at $79,500 intraday on August 21, with a maximum weekly gain exceeding 26%—the largest single-week gain since March 2023. Discussions about a bull market comeback quickly heated up.
This rebound once again validated several clear patterns in the crypto market.
Pattern 1: Directional Shifts Are Highly Dependent on U.S. Policy Cycles
Looking back over the past four years, nearly every major turning point in cryptocurrency has aligned with the rhythm of U.S. fiscal and regulatory policy. The core drivers of this rebound can be boiled down to two factors.
First, the long-term bond buyback policy triggered a reversal in macro liquidity expectations. On August 19, U.S. Treasury Secretary Bessent announced an increase in the single-purchase size of 10- to 30-year long-term Treasury bonds from $2 billion to at least $4 billion, in response to surging long-end yields and a sharp sell-off in long-term Treasuries. The market interpreted this as the government easing its own borrowing costs through accommodative operations, weakening the dollar and driving capital toward alternative stores of value like gold and Bitcoin. As a high-beta risk asset, Bitcoin posted the most pronounced gains among similar assets.
Second, Trump's push for crypto legislation fueled a rebound in risk appetite. Around the same time, Trump met with executives from Coinbase, Kraken, Ripple, and other crypto industry leaders at the White House, publicly urging Congress to pass the CLARITY Act as soon as possible to clarify the jurisdictional boundaries between the SEC and CFTC over digital assets. This move was seen by the market as a signal of declining regulatory uncertainty.
On August 18, the SEC also proposed new draft rules for public crypto token sales, which the market dubbed a legitimate version of ICO 2.0. The wild ICO model of the past is evolving into a regulatory framework with caps, disclosure requirements, and exit mechanisms.
Pattern 2: Spot ETFs Have Become the Market's Bellwether
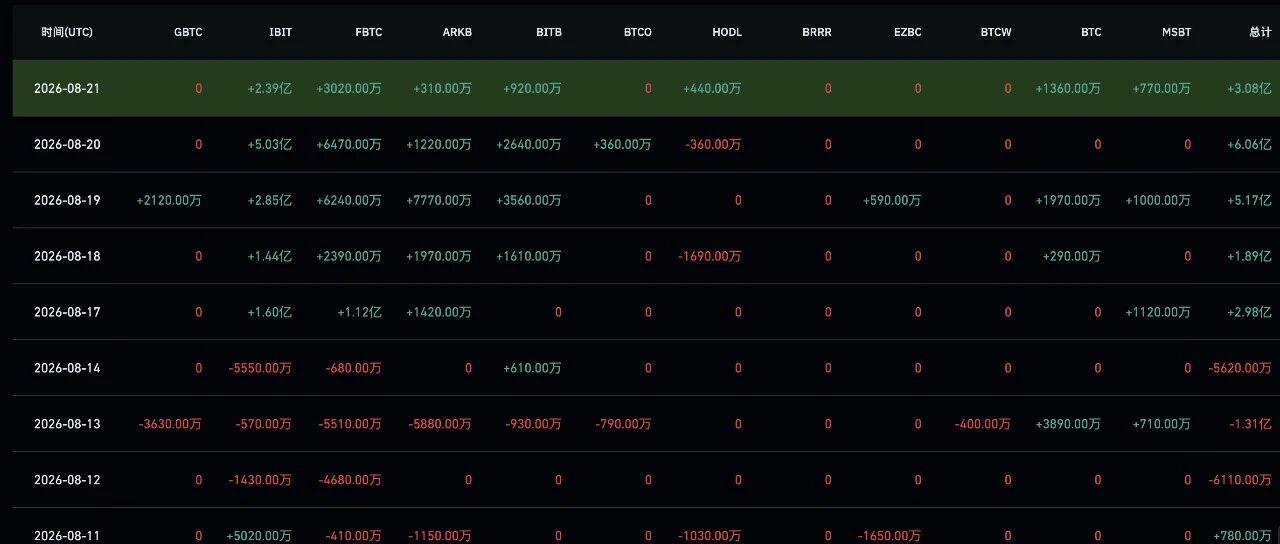
Spot Bitcoin ETFs moving ahead of the market and leading price trends has become one of the most notable structural features over the past two years. The crypto market's full-scale breakout began on August 19, but spot Bitcoin ETFs had already shown sustained net inflows days earlier, precisely timing the ignition point.
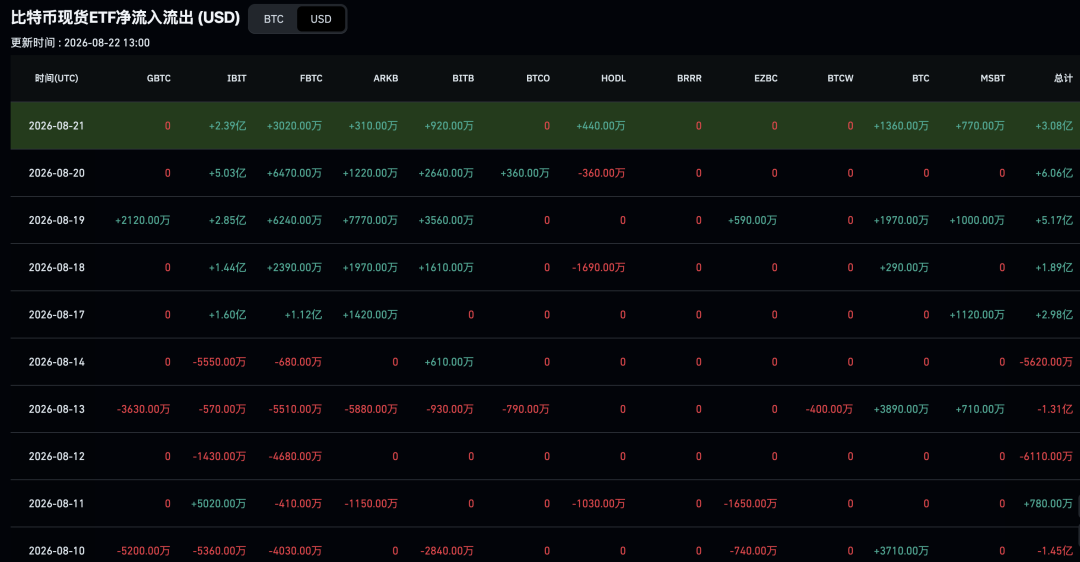
On the data front, U.S. spot Bitcoin and Ethereum ETFs saw combined net inflows of $2.6 billion last week (the week ending August 21), the highest weekly figure since October 2025. Spot Bitcoin ETFs accounted for approximately $1.9 billion in net inflows, with weekly trading volume surging from $6.9 billion the prior week to $22.1 billion—a 219% increase—and total net assets rising from $76.6 billion to $96.1 billion. Spot Ethereum ETFs recorded net inflows of $697.2 million, the highest since the week of October 3, 2025, with weekly trading volume jumping from $1.9 billion to $6.9 billion, a 259.4% increase. Both ETF categories posted their largest weekly net inflows since 2026, following combined net outflows of $392 million the previous week.
Pattern 3: Bitcoin's Rally Drives Rotation Across the Entire Market
After Bitcoin broke out first, capital gradually spilled over, with Ethereum, quality altcoins, and trending meme coins taking turns to rally, with gains amplifying in a stepwise fashion. This is a transmission chain that has been repeatedly validated in the crypto market.
Ethereum started from around $1,900 last week, peaking at $2,546, with a weekly gain of 29.8%, outperforming Bitcoin's 22.9%. The ETH/BTC ratio recovered to around 0.031, and market cap climbed back above $280 billion. Supporting factors included substantial inflows into spot Ethereum ETFs, tightening exchange supply (ETH held on exchanges fell from roughly 7.7 million in early June to about 6.54 million by mid-August, a decline of around 15%, with over 42 million already staked), and the regulatory tailwind from the SEC's new token sale rules.
Bitcoin set the stage, but what truly ignited sentiment were the altcoins and meme assets with far more dramatic multiples. Among the top 50 altcoins by market cap last week, the five biggest gainers were ENA, PUMP, Stacks, Trump, and Zcash.
ENA topped the list with a 100.75% weekly gain, driven by Coinbase's announcement of a strategic partnership with Ethena, planning to offer products based on the USDe stablecoin to over 100 million users, and making its first open-market purchase of ENA tokens to invest in Ethena. FalconX also launched a $1 billion secured warehousing facility, deploying USDe's underlying assets into institutional lending.
PUMP gained between 88% and 99%, with market cap surpassing $2 billion, benefiting from the Solana ecosystem's meme craze. STX rose approximately 82% to 94%, lifted by the resurgence of Bitcoin ecosystem narratives. TRUMP gained 79% to 91%, resonating with Trump's push for crypto legislation. ZEC climbed 75.15%, trading at $851 and hitting an all-time high during the week—the only legacy privacy coin among the top five to reclaim its historical losses.
The meme sector also showed remarkable elasticity. New BNB Chain meme coin Niulai surged 30.3% on August 21 alone, with market cap briefly touching $70 million. Solana's Book of Meme (BOME) posted a 95.57% weekly gain.
Amid the Frenzy, Don't Miss One Key Fact
The gradient of gains outlines the full path of capital moving from caution to euphoria. But two data points deserve a sober look.
First, most leading gainers remain far below their all-time highs. ENA's current price is about 89.2% below its peak, PUMP is roughly 39.7% lower, STX is down about 94%, and TRUMP is off approximately 96.4%. The rebound is an elastic recovery from oversold conditions, not a full reclaim of lost ground.
Second, policy and regulatory news are the core variables driving this round, and policy pacing is inherently sudden and reversible. Capital prices in quickly based on expectations, and it can just as quickly retreat when those expectations fall short.
The crypto market has never lacked stories of huge multiples; what it lacks is the clarity to see where your holdings sit in the transmission chain amid the frenzy.